GUI Instructions
This is the explanation on how to use the application to create vegetation maps. The first step is to download the application. On the Github page, click on clone or download and then choose Download zip. Then unzip the folder. Open the file Veg_class_flood_plains.Rproj. To install the required packages, copy the following code to the console and run it.
## Install and load the required packages
## This is only necessary if they are not installed yet
install.packages("raster")
install.packages("rgdal")
install.packages("randomForest")
install.packages("leaflet")
install.packages("rLiDAR")
install.packages("htmlwidgets")
install.packages("gWidgetstcltk")
To start the program. Open the file VegetationClassification.RData. The main window will pop up. It can be seen below.
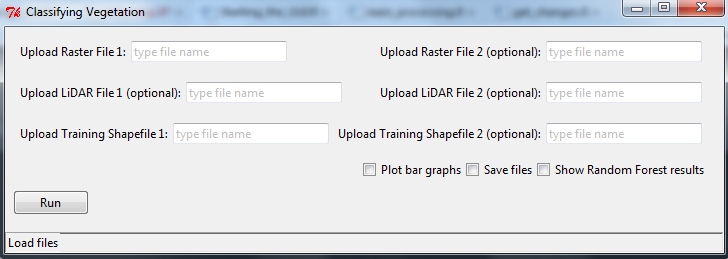
This main window consists out of fields to load your data into the program. To create a map, you need at least one areal image and one training polygon dataset. If you only want to create one map, all you have to do is to upload your imagery in the field Upload Raster File 1 and your training dataset in the field Upload Training Shapefile 1. The input files must be stored in the data folder. Do not enter the file extension, but only the name. Then you can use the checkboxes in the lower right corner of the window if you want to plot the graphs, save the output files in the output folder or show the results. If you run the programme twice, the results will be overwritten. After uploading the required datasets, you only have to press the Run button, and the application will create the map.
However, it is also possible to compare vegetation images from different years. In this case, the application will automatically analyse the differences between the two images and create maps of each year as well as vegetation change maps and a statistical analysis of the vegetation change. If you have two different training polygon files for the two images, you have to upload the one that should be used for the second image in the field Upload Training Shapefile 2. This is optional as the classification of both images can also be done based on only one training dataset.
Another optional function is the inclusion of LiDAR data into the classification. If LiDAR data is available, you can upload it in the fields Upload LiDAR File 1 for the first image and Upload LiDAR File 2 for the second image, respectively.
If you run the programme twice, the results will be overwritten. To avoid this, export them to another folder or change the names of the files.
If you are more interested and want to start the GUI directly inside RStudio, choose the file Starting_the_GUI.R from the lower right window after opening the file Veg_class_flood_plains.Rproj . It looks like shown below.
### Run these first to load the functions
source('Functions/main_processing.R')
source('Functions/GUI_setup.R')

### run this to open the GUI, then enter the file names and press run... this will take a while!
GUI_setup()
Install the packages if they are not yet installed on your computer. This only has to be done once. After that, execute the rest of the script. The main window will pop up, as already shown above.